Facebook Ads play a big role in the marketers and advertisers world. With a whopping potential reach of 2.11 billion people and 63.7% of Americans over 13 being exposed to Facebook Ads regularly, there’s no denying the untapped potential this platform promises. However, one thing deters marketers from taking advantage of this service: the Facebook Ad cost.
Knowing how much Facebook Ads cost, how costs are measured, costs by industry, the factors influencing your costs, and how you can reduce the amount spent on product advertising can help you maximize your Facebook Ads performance. Read more to find the answer to how much Facebook Ads cost and everything to know about this solution.
So, how much do Facebook Ads cost? The price is determined by your bidding model:
You should frequently track your key Facebook Ads metrics to ensure Facebook advertising success and understand the amount of spend on Facebook Ads in a specific period.

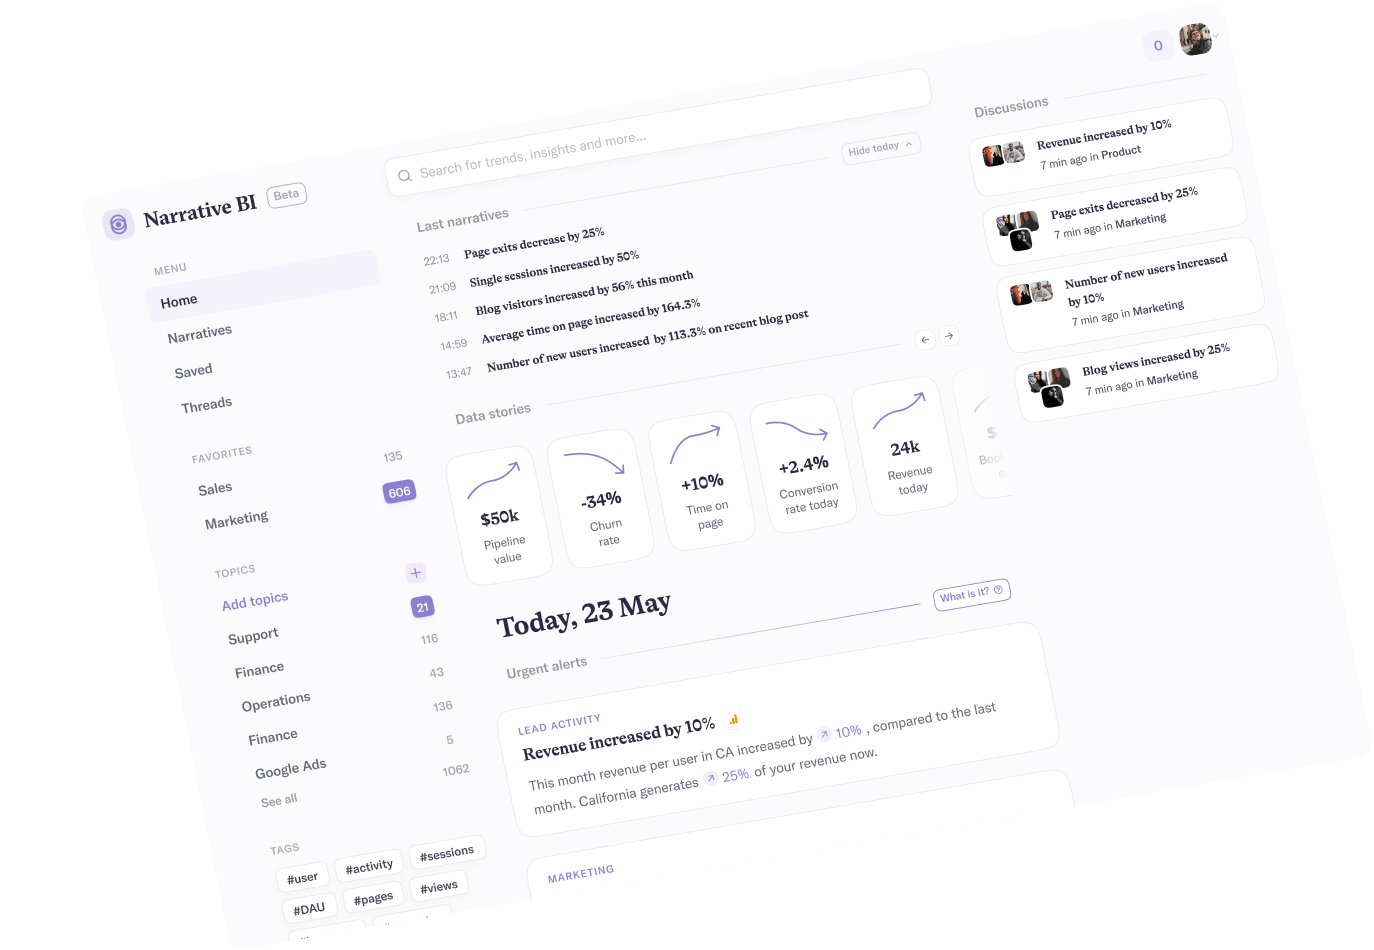
Narrative BI allows you to receive daily, weekly, or monthly Facebook Ad reports and insights sent to your email or directly on the Narrative BI platform.
Your cost-per-thousand views, or CPM, is a measurement of your benchmarks that determines the total cost of your campaign based on how often it’s shown to users. CPM lets you understand how effective your campaign is to optimize your ad spend. Measuring CPM helps you ensure that your content reaches its desired audience and allows you to make informed decisions within your budget.
Over five years, the average CPM has gone from $11.2 in 2017 to $14.9 in 2021, with an average value across various locations. 2020 saw severe fluctuations because of the COVID-19 pandemic. During this period, the CPM rate went down over 30%, with a month-long period between February and March.

Tracking your CPM over time is crucial to understanding your Facebook advertising cost. Narrative BI provides insights into your CPM to track and compare your ad metrics over time and receive reports via email or on the platform on a daily, weekly, or monthly basis.

AdCostly data from quarter 3 of 2021 shows that the United States is the leader in CPM rates over time, with an estimated $35 per 1,000 user impressions. This ranking was followed by South Korea at an estimated $34 per 1,000 impressions and Australia at $33.5 per user impressions.
Lower CPM rates were found in countries like Canada, Japan, the United Kingdom, Germany, and France, as seen in the table below.

Your CPC is a metric that measures the total cost incurred with each click on an advertisement. Your CPC indicates your campaigns’ effectiveness and the value they provide for your investment. It’s calculated by dividing the cost of your online campaign by the number of clicks received.
Over time, the average CPC for Facebook Ads has remained relatively stable, falling around 40 cents per click. The average CPC ranges from $0.39 in 2017 to $0.44 in 2021, $0.54 in 2022, and $0.51 in 2023.
Tracking your CPC provides essential insights into your campaigns. Narrative BI lets you track and compare your Facebook Ads CPC to understand your online campaigns through actionable reports and insights.

CPC rates across different countries can range significantly. South Korea leads with an average of $3.85 per click in the third quarter of 2021. Many Facebook Ads CPC rates fall around $2, while others cost as little as $.1-$.2 per click. Here are some key examples:

CPC ranges depending on your industry and what you’re marketing:
Between January 2020 and September 2023, the average Facebook Ads CPL was $6.76. However, this number can fluctuate significantly depending on the industry:
Your Facebook Ads CPA determines the amount paid when an audience member engages with your content through Facebook Ads. It includes actions like link clicks, sign-ups, page visits, lead generation, app installation, and more.
The average CPA for Facebook Ads by industry can be broken down into the following:
One of the most important factors affecting the cost of your advertising strategy is your audience size. If you’re spending on campaigns targeting broader audiences rather than specific segments, you’ll likely spend less on your advertising campaign. Companies marketing to a specific, small customer base must spend more to meet tailored audience needs.
Your audience’s location impacts how much you’ll spend on advertising, so depending on your country, you might spend more or less on your campaigns. For example, in the United States, the average CPM in 2021 was $35, compared to Pakistan, where the average CPM was $1.
Additionally, consider how many people are bidding on a local space. The more people bidding within a space, the more you’ll spend to reach your audience.
Your ad objectives influence the value of specific goals throughout the campaign funnel. For instance, if your goal is to convert leads and generate purchases, you’ll likely spend more than if your objective is to encourage engagement or increase brand awareness.
Where your ad places will further influence your Facebook advertising cost. Your Facebook Ads can appear in any of the following places:
You’ll spend higher or lower ad costs depending on where you want your ad placed. For instance, Instagram has the highest cost CPC ($0.80), closely followed by Instagram Stories ($0.78). In comparison, Facebook’s Audience Network has relatively low CPCs of an additional $0.20.
Your daily budget will impact how much you spend on Facebook Ads. For smaller daily budgets, Facebook might take longer to understand your audience’s behavior, reach your target customers, and encourage high engagement. When beginning a new ad campaign, you’ll encounter a higher upfront cost as Facebook understands your audience more. Higher engagement means fewer daily costs, so the initial investment is often worth it long-term.
You can also track and compare your Facebook Ads daily budget to understand your costs better and receive frequent reports through Narrative BI.
Narrative BI provides reports on your schedule so you always know your daily budget compared to your spending.
How you instruct Facebook to spend your daily budget impacts the amount you spend. The primary bidding strategies for Facebook Ads include:
These options fall into budget-based (lowest cost and highest value), goal-based (minimum ROAS and cost cap), and manual strategies. It’s important to research, decide which bidding strategy meets your goals best, and shape your campaign around this method.
Your CTR measures the number of clicks your ad gets divided by the number of times it appears to users. It indicates how well your campaign engages users and convinces them to take action. If your CTR is low, you might face higher advertising costs, as a low CTR indicates a problem to Facebook in your ad’s messaging. The higher your CTR, the lower your CPC.
Anyway you can track and compare your Facebook Ad CTR through Narrative BI in daily, weekly, or monthly reports.

Bidding on Facebook Ads typically costs more during peak hours when users are most active on Facebook. The cheapest time to bid on ads is between midnight and 6 a.m. However, this isn’t always accurate, so don’t feel you have to bid only during these hours.
Your eCommerce ads are set to run on a 24/7 schedule, but the best time to schedule your ads is between Wednesday and Friday from 8 to 9 a.m. While these hours might generate more initial traffic, remember that costs will typically be more expensive.
Advertising will cost more depending on the season. For example, ads generally cost more during the last few months of the year because of holidays like Thanksgiving, Christmas, Black Friday, Cyber Monday, and New Year’s Eve. Because these are peak shopping times, there’s a higher demand for advertising space. While you can expect to spend more during this time, it’s important to remember these periods are an excellent time to generate sales through an effective advertising campaign.
Remember: your amount spent on Facebook Ads will differ depending on your industry. Some industries are far more competitive than others and might have a more crowded ad space, meaning you’ll have to spend more to get noticed against your competition.
Your campaign objective will influence how much you spend. Your objective determines the results you want to achieve through your ad campaign. To keep your costs lower, you might focus on brand awareness and engagement compared to other, higher-cost objectives.
Keep your audience targeting narrow. If your ads are smaller and more relevant to a specific audience, you have a better chance of winning an ad auction within your budget. You can start with a broader audience so Facebook can easily find users that will connect with your content, then slowly narrow your results to customers who fit specific criteria. It’ll lower your audience size but improve your ad relevance scores, which pays off in the long run.
You can track your Facebook Ads campaign audience targeting metrics through Narrative BI.
Audience overlap indicates whether audiences for different campaigns overlap with one another. Overlapping audiences can minimize the effectiveness of individual campaigns, as you’re essentially bidding against yourself. Consider Facebook’s tools and options for audience overlap to determine where your audiences intersect and how to reduce this problem.
Retargeting campaigns help re-engage users who previously interacted with your ad campaigns or business. These campaigns help lower your costs by targeting people who are already familiar with your brand, boosting your chance of getting customer conversions at a lower cost.
The more relevant your ad campaign, the more you can target users likely to engage with your brand. Determine your customers’ pain points, interests, goals, and other factors that help you understand your audience and create campaigns that address audience problems.
The more often your campaign appears to an audience in the same format, the less likely users will engage with your brand. Lowering your ad frequency score will reduce audience fatigue, so refresh your campaigns frequently and try different placements to avoid customers getting frustrated with your repetitive content.
A/B testing helps you compare different ad versions to determine what works and what doesn’t. Test individual variables in your ads, such as the text, images, videos, and other factors, and see how they change your campaign outcome. Only change one variable at a time–doing more makes it impossible to determine what needs to be changed with your campaign.
Pixel and Facebook Conversions API are built to help you understand your ad performance. Using these resources helps you determine what audiences connect with in your campaigns, meaning you can optimize your content, make the most of your budget, and lower costs.
Your post-click experience is as important as the audiences’ experience with your advertisement. Ensure your ads direct users to relevant, well-designed content. If your landing pages are poorly designed or your website takes too long to load, most users will leave your site and abandon their purchase.
If you want to reach a broad audience, there’s no option like Facebook Ads. As of the second quarter of 2023, Facebook had roughly three billion monthly active users, making it the most-used online social media network globally.
Facebook lets you focus on precise audiences, meaning you can reach your target customer for a better chance of reaching your ad objective and a higher return on investment (ROI). This precision is unmatched by other platforms.
Facebook doesn’t limit you to one type of budgeting and offers lifetime or daily budgets to meet your campaign needs without exceeding your ideal ad spend.
While Facebook Ads come with a cost, it’s far more affordable than other options. Facebook’s average CPC in the United States is $2.25/click, compared to platforms like LinkedIn, with an average CPC of $5.39 (or $8-$11 for sponsored content).
Understanding your FB Ads cost is crucial and requires you to have access to track and compare all of your key Facebook Ads metrics. The cost of Facebook Ads is always changing, meaning you need a resource to simplify this process so you can focus on growing your audience through a digital campaign.
Knowing the quality of your ad campaigns is possible using Narrative BI. Narrative BI provides a holistic view of your key ad metrics in easy-to-understand reports delivered to you daily, weekly, or monthly. You can track your campaigns with Narrative BI, discover ways to lower your costs, and pay less for Facebook Ads.
Sign up for Narrative BI today to start receiving marketing reports and insights!
The data in this article was aggregated from the following sources:
https://www.narrative.bi
https://www.wordstream.com
https://revealbot.com
https://adespresso.com
https://www.adstage.io
https://www.statista.com


 Pro Tip
Did you know that Narrative BI makes tracking your marketing performance effortless? It connects to your digital marketing channels and generates automated reports and alerts.
No more manual work, spreadsheets, and data silos. Narrative BI generates natural language insights in an easy-to-read format so you can focus on growth.
Try Narrative BI for freeConnect your favorite data sources in two clicks and start receiving marketing reports and actionable insights today!
Connect your data sources

Google Analytics is ultra-powerful when it comes to managing our clients’ MarTech stacks, but it’s easy to get lost in the overwhelming amount of data there. Narrative has given us a way to get “just the good stuff”, and the most important metrics we need for making daily decisions on behalf of my agency’s clients from Analytics to Ad Spends. The condensed insights we get from Narrative are incredibly helpful, and now indispensable in our daily mix of tools.