With roughly 3 billion monthly active users (MAUs), there’s no denying the potential Facebook has for brands seeking a broad market. Facebook Ads play a significant role in customer acquisition for many organizations. Because these ads are shown to a massive audience, brands can enhance their marketing efforts and reach their target customers when they use Facebook Ads for acquisition.
However, before diving into this advertising solution, businesses must consider the total cost per acquisition (CPA). Optimizing the ratio between advertising expenses and customer conversions means you’ll earn more revenue on conversions and have a higher return on investment.
What is the CPA that Facebook Ads have for your brand? What's the average CPA on Facebook? And how can you lower your CPA for a bigger profit? This article will explore the world of CPA Facebook metrics to answer your questions.
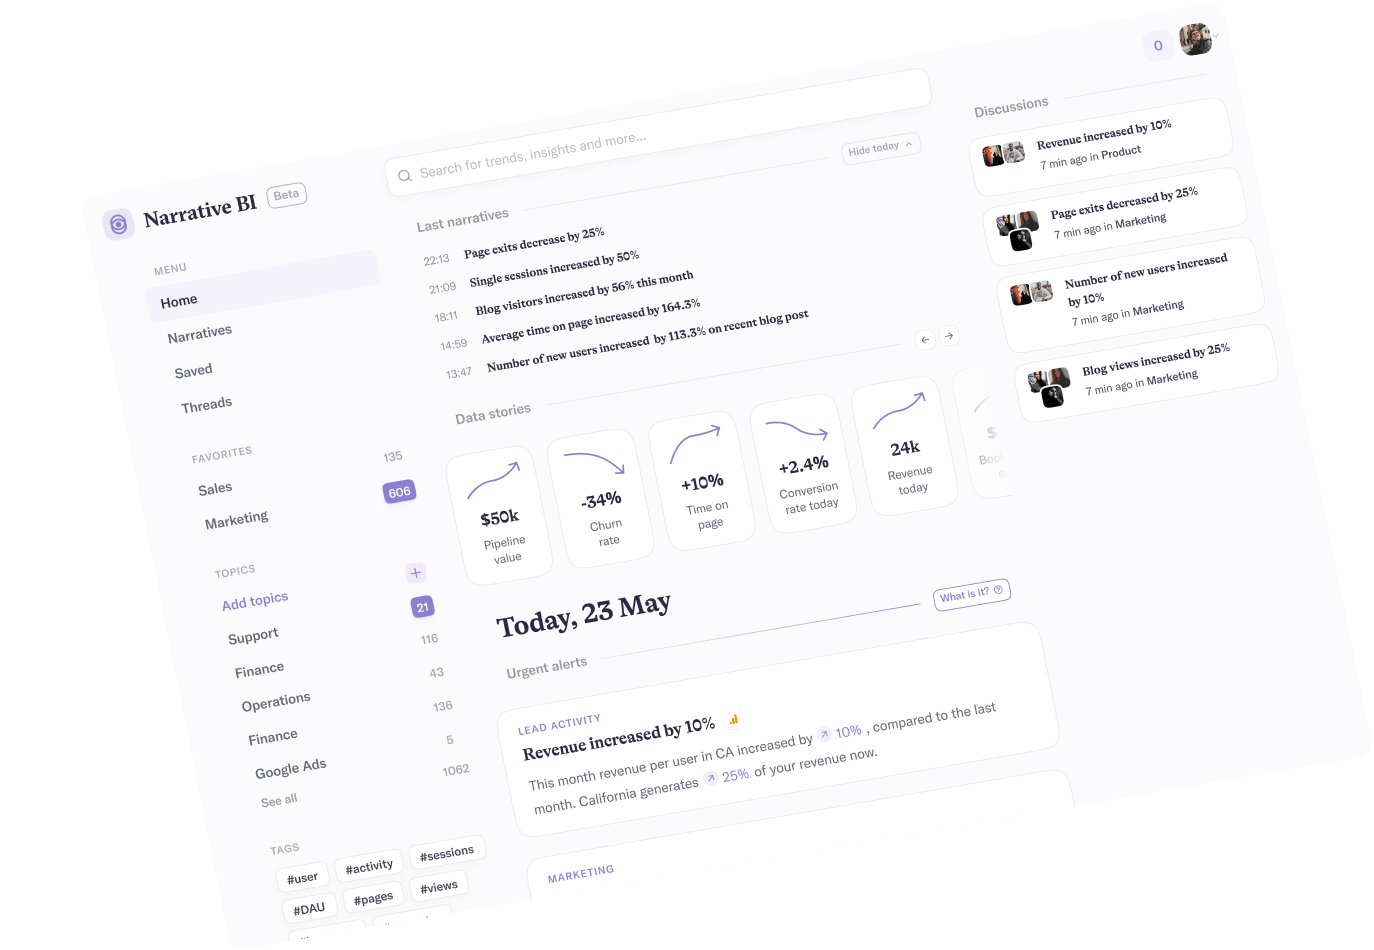
By the way, as we discuss the intricacies of Facebook CPA, it's worth introducing the Narrative BI platform. Narrative BI helps businesses track key Facebook Ads metrics for reports and valuable insights via email or on our platform daily, weekly, or monthly schedule.

Our solution ensures you understand your Facebook CPA and other ad metrics through comprehensive data, empowering you to make well-informed, data-driven decisions.
Read more to find out everything to know about Facebook Ad CPA and how to reduce it.
Facebook CPA (cost per acquisition/action) measures the amount paid whenever an audience member engages with your content through Facebook ads. CPA is a metric that lets Facebook charge brands for promoting content to a specific audience. CPA actions include link clicks, page visits, signing up for a newsletter, page likes, lead generation, and app installation.
Facebook Ads CPA helps you track other things related to your advertising performance, such as your cost per click (CPC), click-through rate (CTR), and other crucial metrics and KPIs. CPA indicates whether your content connects with your audience and whether your conversion rate is high or low. If you have a high CPA, your campaign is likely unsuccessful, while a low CPA indicates that you’re on the right path.
So what is the average cost per action on social media like Facebook? The CPA on Facebook can range from as little as $7.85 to as much as $55.21, with the average CPA being $18.68 across industries.
Some industries have much higher CPAs than others; for example, the education industry usually has the lowest CPA on Facebook, while the technology industry has the highest. Other industries with higher-than-average CPAs on Facebook include the following:
Not sure what your Facebook Ad CPA is? You can track your Facebook CPAs and CPAs from other advertising sources like Google Ads with Narrative BI. Narrative BI provides reports and valuable insights regularly to suit your schedule.

Here’s a closer look at CPA by industry:
Knowing how to calculate the Facebook CPA is a crucial step to lowering your CPA. Your cost per action can be calculated with the following formula:
CPA = Cost to the Advertiser / Number of Actions Taken on an Ad
For example, if you pay $100 to push your campaign and receive 25 actions taken on the ad, your CPA would be $4. If you paid $300 to push your advertisement and received 50 actions, your CPA would be $6.
So what is a positive Facebook CPA? The simple answer is that it differs depending on various factors. Details like your industry, niche audience, and amount of competitors will all influence the ideal number you should expect from a good Facebook CPA. Consider the average CPA for your industry based on the table above. Additional factors to consider include the following:
eCommerce businesses typically see an average CPA of around $20–if this is the case for you, you’re in good standing. However, it’s important to note that there’s the possibility of a “bad” CPA.
Similar to a good CPA, a bad CPA depends on several factors, such as your industry, competition, and target audience. A bad Facebook CPA is an unusually high number that exceeds industry standards. A bad CPA doesn’t show any return on investment.
Poor CPAs indicate that your advertising strategy can benefit from a new approach. Monitor various metrics to determine ways you can enhance your advertising performance.
So your CPA is less than ideal, and your ad campaigns are struggling to be successful. While it’s undeniably frustrating, there are ways you can lower your CPA for Facebook ads to pay less and earn more. Consider the following.
Split testing your ad can help you uncover strategies to lower your CPA. This process involves using more images for a campaign to test which is most effective with the target audience. A split test allows you to determine what works best and enhance your digital marketing strategy, lowering your CPA costs.
You don’t have to do the same old for your next ad campaign. Formats like video advertisements are ideal because they are lower cost and less expensive per view than other formats. Video views could lower your CPA, making incorporating video into your campaigns essential.
A bad CPA could be a result of poor customer targeting. Narrow your target audience to get specific insights into your main consumers. You can focus your ads on the most relevant audience members to increase the chance that your content will resonate with the right people. While fewer people will see your ad, more people will find it relevant, boosting your relevance score and lowering your CPA.
You can lower your CPA by boosting your click-through rate (CTR). Increasing your CTR is possible through different advertising strategies, such as visually appealing images that compel viewers to click and find out more about your brand.
Narrative BI lets users track Facebook Ads CTR so you can always stay on top of your latest advertising metrics and easily lower your CPA. Through Narrative BI, you can receive reports and crucial insights on a regular schedule to ensure that you understand the full picture of your advertising performance.

If nothing seems to work and you still have a high CPA, your ad schedule could be the culprit. Your ad metrics will reveal that you receive higher engagements at specific times. Focus your ads during this time to increase the chances that a user will become a conversion and lower your CPA.
Your website landing page must be built to impress, or you’ll likely struggle with high CPAs. Because a bad landing page lowers your conversion rate, your CPA increases. Consider the stylistic elements of your landing page, the page’s content, and your CTA to determine where you can improve.
Facebook Ad fatigue happens when your audience gets shown your advertisement excessively, meaning your CTR drops while your frequency rate increases. Users who see your ad too often get familiar with the content and aren’t inclined to click and explore, causing your CPA to increase.
This issue is avoidable when you take the opportunity to rotate your ads and lower the likelihood of ad fatigue. Your audience will remain interested in what your brand has to offer next when you put out fresh content rather than consistently pushing an ad they’re familiar with.
Understanding how your Facebook Ads measure up against your competitors is possible by tracking crucial metrics and using advanced reporting tools. Tracking your most important metrics is critical for your brand’s success on Facebook–but with the many metrics to choose from, you might need help understanding which are most relevant to your business. Understanding your metrics and identifying relevant KPIs to evaluate your brand’s performance is possible with Narrative BI.
Narrative BI provides a holistic view of your key metrics in a simple, single platform with easy-to-understand reports delivered directly to your inbox. Whether you want to receive a report on a daily, weekly, or monthly schedule, you can access all of the tracking capabilities you need with Narrative BI.

Narrative BI makes it easy to receive valuable insights and enhance your marketing performance in no time.
Sign up for Narrative BI today to start benefiting from the Narrative BI solution and monitor your key metrics.


 Pro Tip
Did you know that Narrative BI makes tracking your marketing performance effortless? It connects to your digital marketing channels and generates automated reports and alerts.
No more manual work, spreadsheets, and data silos. Narrative BI generates natural language insights in an easy-to-read format so you can focus on growth.
Try Narrative BI for freeConnect your favorite data sources in two clicks and start receiving marketing reports and actionable insights today!
Connect your data sources

Google Analytics is ultra-powerful when it comes to managing our clients’ MarTech stacks, but it’s easy to get lost in the overwhelming amount of data there. Narrative has given us a way to get “just the good stuff”, and the most important metrics we need for making daily decisions on behalf of my agency’s clients from Analytics to Ad Spends. The condensed insights we get from Narrative are incredibly helpful, and now indispensable in our daily mix of tools.