
Facebook is a leader in the ad playground. Statistics reveal that there are roughly ten million advertisers on Facebook.
With such a staggering number of advertisers and the different metrics the platform uses, new marketers or business owners may feel intimidated.
Understanding Facebook benchmarks gives businesses that would otherwise strike out with search engine advertising a better, more targeted fighting chance.
The truth is that Facebook ads only matter if you are doing Facebook ads right. That means knowing different Facebook ad data sets and benchmark performances according to your industry.
To help you out, we have gathered, analyzed, and compiled different Facebook ads benchmarks you need to succeed in Facebook advertising. Check them out below.
What is a good CTR on Facebook ads?

The click-through rate or the CTR is an advertising darling. With a CTR, you get to learn how your ads are received by your audience.
Think of it like walk-ins.
If you have a brick-and-mortar store, every person that walks through your door signals interest. There is something about your store that drew them, and they have to decide if they want to buy. When they walk in, they are still looking for that special sauce that drew them in the first place.
This is what an ad click-through rate is. It shows you how many members of your target audience are drawn to your ad.
To calculate your click-through rate, you will need the following metrics:
The complete formula is the total number of ad clicks divided by the number of ad impressions, multiplied by 100.
When it comes to industry CTRs, the legal industry is at the forefront. The industry has a 1.61% click-through rate. Legal is followed by retail with a rate of 1.59% and apparel at 1.24%.
The job search industry has the lowest click-through rate, with 0.47%. However, the global average rate is 0.90%.
Here is a compilation of the Facebook CTRs based on industry:
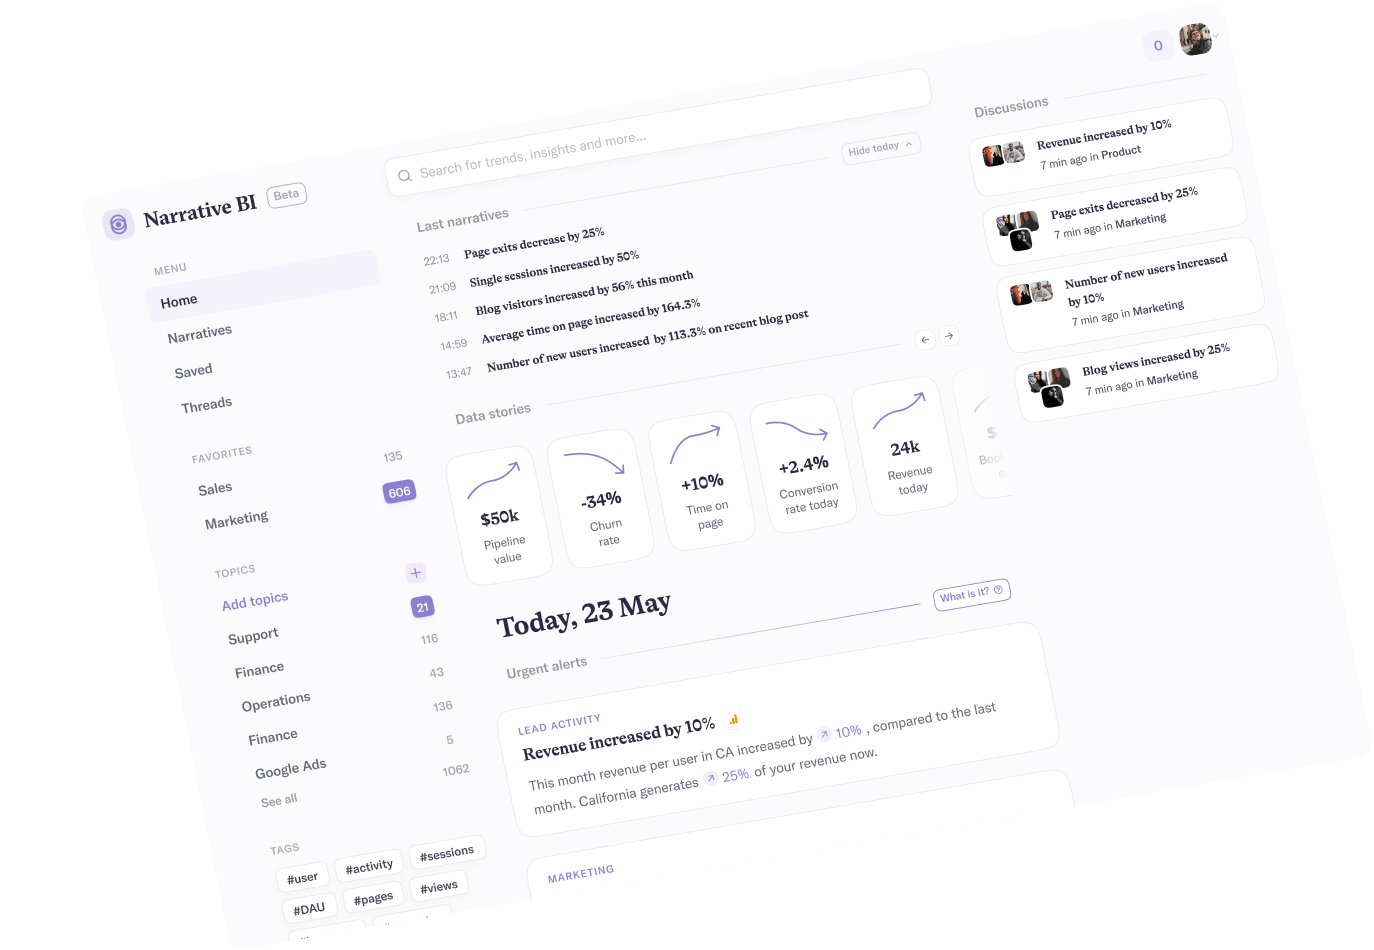
By using data platforms like Narrative BI, you can track the CTR associated with each Facebook ads campaign. You can also enjoy periodic insights delivered straight to your email or accessible directly through the Narrative BI platform.

What is a good CPC for Facebook Ads?

Remember those digital walk-ins we discussed? Cost per click (CPC) reveals how much it costs you to get those walk-ins.
If we go back to the brick-and-mortar store example, we would have to consider all your paid marketing efforts. You would then divide by the number of customers who walked through your door.
This is how you would calculate your Facebook CPC:
You divide the total amount spent on ads by the total number of clicks.
You can track your campaign's CPC and receive performance reports on Narrative BI. View your data on Narrative BI platform or opt to have the reports sent to your email.

The industry with the highest cost per click is finance and insurance at $3.77.
Here is the median CPC for various industries:
What is a good conversion rate on Facebook ADS?

The conversion stage is where you review the number of clicks that took the desired action.
Your desired action will differ according to your specific CTA. Perhaps you want to increase signups, purchases, or downloads. With this benchmark, we calculate how many clicks did exactly that.
To calculate the conversion rates, divide the total number of conversions by the number of clicks and multiply by 100.
The average conversion rate across all industries advertising on Facebook is 9.21%. Fitness sits at the top with a 14.29% conversion rate. Industrial services, however, are scraping the bottom of the barrel at a 0.71% average.
The education industry has the second-highest conversion, with an average of 13.58%.
Below is the average conversion rate per industry:
What is a good CPA on Facebook?

With the cost per action, you pay only for specific actions. Under this Facebook ads benchmark, you decide what your targeted ad result is and pay solely for that action.
For example, you can decide to pay for ad engagements versus views or impressions.
The technology industry has the highest CPA, with an industry average of $55.21. This means that for every desired action, say a link click, tech advertisers foot an estimated $55.21 per click.
Education is on the favorable end, with an average of $7.85 per action. This number is even lower than the overall Facebook CPA average of $18.68.
Here is Facebook's CPA for different industries:
Now that you know industry-specific Facebook advertising benchmarks, let's review factors that impact your advertising costs.
One thing worth noting is that some of the factors below are subject to your advertising goals.
There is no overemphasizing the importance of nailing down your target audience. This is not only important for running Facebook ads but for marketing in general.
Placing ads before the right eyeballs wouldn't just improve conversion rates. It will also ensure that your ad spent is going where it matters.
Through Facebook targeting, you can sift through the platform's 1.84 billion daily users and customize your audience depending on various demographics. Facebook gathers scores of user data like interests, location, and age that help advertisers better narrow down their exact customers.
A quick example: a personal trainer in Charlotte, NC will have a fair conversion rate targeting adults between the ages of 25 and 45 within the city. However, the trainer would see better results targeting the same group but with an interest in fitness and nutrition.
Who are you up against? What are their advertising strategies?
Your competitors play a part, though small, in how much you spend on advertising. Think about it: beverage companies competing against Coca-Cola, whose advertising budget is $4 billion, will have to try and match the company's ad efforts.
This is why the right audience matters. Companies like Coca-Cola have a broad audience. They are not a niche company.
But a new beverage company must be more niche-focused. It will have to focus on a specific target group to maximize conversions while minimizing ad spend.
As we have seen with Facebook ad benchmarks, the type of industry affects the cost of advertising. A general formula is that the higher the product price, the higher the ad price will be.
If you sell high-end products, then you will probably pay more for advertising.
Time of day, time of year, and season all have an impact on advertising costs.
During the holidays, Facebook ads cost more due to the increased demand. You will also see an ad price hike during industry-specific holidays like Cyber Monday or Black Friday.
Most marketers have found that running ads during the day costs more than running them between midnight and 6 a.m.
Our pro tip to any marketer is to not blindly rely on marketing norms. Figure out the times your audience is most active online. This will increase your engagement rates.
Improving your ad content is a multi-dimensional process. It relies on several marketing tactics and your ability to implement them.
Here are our three content-improving tips:
To succeed on Facebook, you have to know your data. Data insights can help you know which strategies are succeeding and which you must abandon.
Our Narrative BI platform collects and compiles various data formats all in one place. It will give you marketing reports with highlighted data insights.

Facebook has three auction bidding methods: goal-based, spend-based, and manual.
Both goal-based and spend-based are automated bidding strategies. They use preset categories to help you run ads. You set a budget and a goal, and Facebook handles the bidding for you.
With the manual approach, you decide all the bidding aspects.
Our last tip is to test and test. Be open and flexible with your strategies. Find out what your Facebook industry benchmarks are and adjust accordingly. Cut out what doesn't work and improve on what does.
Advertising is a science. You will discover the strategies that work for your business as you go along.
But your industry's Facebook benchmarks are a good place to start.
At Narrative BI, we tell data stories. Throughout the years, we have helped clients understand their customers through valuable insights.
Get started for free to see how our data-narrating platform works.
The data in this article was aggregated from the following sources:
https://www.wordstream.com/blog/ws/2017/02/28/facebook-advertising-benchmarks
https://revealbot.com/facebook-advertising-costs/
https://investor.fb.com/investor-news/press-release-details/2021/Facebook-Reports-Fourth-Quarter-and-Full-Year-2020-Results/default.aspx


 Pro Tip
Did you know that Narrative BI makes tracking your marketing performance effortless? It connects to your digital marketing channels and generates automated reports and alerts.
No more manual work, spreadsheets, and data silos. Narrative BI generates natural language insights in an easy-to-read format so you can focus on growth.
Try Narrative BI for freeConnect your favorite data sources in two clicks and start receiving marketing reports and actionable insights today!
Connect your data sources

Google Analytics is ultra-powerful when it comes to managing our clients’ MarTech stacks, but it’s easy to get lost in the overwhelming amount of data there. Narrative has given us a way to get “just the good stuff”, and the most important metrics we need for making daily decisions on behalf of my agency’s clients from Analytics to Ad Spends. The condensed insights we get from Narrative are incredibly helpful, and now indispensable in our daily mix of tools.


