

Monitoring marketing performance is crucial in the competitive landscape of digital marketing and can make or break a company’s overall campaign success. Advertising agencies that handle Google Ad Campaigns for their clients are likely familiar with Google Ad reporting, a feature that helps campaign managers identify areas of improvement within their current campaigns. Formerly referred to as Google Adwords reports, these reports provide essential insights into an ad’s pay-per-click (PPC) performance, click-through rate (CTR), and cost-per-click (CPC).
These reports collect critical information about keyword usage and several metrics to determine how an ad campaign performs overall compared to competitors. However, with the numerous metrics presented in Google Ads reports, leaders often find it challenging to determine which metrics are best to focus on in driving success and optimizing ad performance.
Individuals can access their predefined reports through their Google Ads account under the campaigns section of the platform. Following this, individuals can select “insights & reports” to access the report editor, where they’ll find a list of predefined reports available for review. Despite the easy process, simply having access to a report isn’t enough–professionals need to understand the metrics they’re looking for and how to use them to their advantage. This article will help individuals with this process by exploring the key metrics to prioritize in Google Ads reports for clients and how to use these metrics to achieve measurable success.
{{fs-cta-pro-tip}}
Different information is included in a Google Ad report depending on the insights business leaders are seeking for their clients. Understanding the report variations can help leaders serve clients and meet individual client needs for Google Adwords reporting. The following are some commonly-used Google ads report types to gain unique insights.
An account performance report is an automated report generated for individual clients monthly. This report includes all relevant data and financial information for a client’s account, including payments, budgets, and billing. Additionally, this report includes the number of clicks and impressions received by specific ad campaigns.
Depending on the selected conversion type for each Google Ads account, the report will provide unique metrics of a client’s cost, conversions, cost per action (CPA), revenue, and return on ad spend (ROAS). Through these insights, companies can unlock critical information about how well a client performs compared to their competitors and whether current advertising investments are paying off.
The campaign performance report includes information regarding a client’s ad groups and keyword performance. This report depicts the number of clicks and impressions an ad receives, the CTR, the estimated number of customer conversions, and the average cost-per-conversion.
A campaign performance report is typically most suitable to determine the ads within a group or campaign perform the best with audiences to optimize these campaigns and increase the conversion rate.
A campaign performance report allows leaders to optimize PPC for specific ad campaigns while shifting attention away from ineffective marketing strategies and toward innovative or consistently effective campaigns.
An ad group performance report in Google Ads depicts relevant information about keywords and ads within a specific campaign or ad group. The ad group performance report sorts these results by displaying conversions, the average cost-per-conversion, and the clicks and impressions for specific ads. An ad group performance report is generated by Google Ads teams daily or weekly.
This performance report can be filtered by several additional factors, such as the type of campaign, the ad group a specific ad belongs to, the type of advertisement, and the advertising channel. This report provides a comprehensive dashboard to filter results and understand ad performance on several levels.
The keyword performance report displays all keywords used within a client’s account, organized by their CTR, conversions, clicks and impressions, and average ranking position for a specific keyword and period. This report is crucial for clients to stay up-to-date on what keywords are performing best and converting the most leads.
Because keyword trends are constantly changing, it’s crucial to keep up with trends and adjust ad campaigns as necessary to meet new customer demands. A keyword performance report is the wisest way to gain insights into how well individual keywords are performing and which keywords should be optimized to drive more traffic to a campaign.
Finally, a search term performance report displays all search terms, known as queries, that trigger ads to appear on search result pages. This information includes the total clicks and impressions on an advertisement. It is best generated weekly or monthly to ensure that clients are aware of how their keywords are performing and whether they’re appearing in the best search results to generate the most impressions.
Similar to the keyword performance report, this report is crucial because it ensures that, when people search for terms relevant to a client’s ad campaigns, the client’s ads are what appears first and foremost. Without up-to-date search terms or knowledge of how well a current campaign’s search terms are performing, optimizing future ad campaigns becomes challenging.
{{fs-cta-testimonial-bloxspring}}
Given the several types of Google ads reporting, leaders might be uncertain about what information should be included in a client’s standard Google Adwords report. Ad reports require extensive information about a campaign’s key performance indicators (KPIs), which are the focus of any comprehensive report.

KPIs depict a client’s Google Ads progress overview for a simple, integrated view of their current performance. Additionally, Google Ad reports should include current and historical data to understand an organization’s overall performance over time fully. The critical information and KPIs necessary for a thorough Google Ads report includes the following:
Tracking KPIs is integral to understanding a client’s ad campaign performance. Understanding an ad’s KPI trends ensures that companies are progressing toward a desired outcome within their ad groups while offering a comprehensive comparison to understand how a client’s performance has changed over time. KPI trends ensure advertisers know the correct steps to improve their current position.
Some additional reasons why tracking KPI trends is crucial to ad campaign success include the following:
By understanding the importance of KPIs and KPI trends, advertising teams can improve the chance of ranking higher in Google search engine results. However, beyond tracking KPI trends, teams must understand the value that custom Google Ads reports can provide to an ad’s overall success.
Knowing how to create custom Google Ads reports is crucial for teams looking to appeal to different clients and develop unique ad campaigns for comprehensive performance analysis. Google Ads allows users to create numerous custom reports to meet specific business goals and ad requirements.
To create custom Google Ads reports, follow these steps:


{{fs-cta-integrations}}
While Google Ads reporting is a crucial asset for many organizations, some limitations to the platform hold some ad campaigns back from success if the proper measures aren’t taken. A significant limitation of Google Adwords is its inability to automate account performance reports for teams handling several clients simultaneously.
Without high-quality tools and software to help teams navigate Google Adwords, reporting functionalities might seem limited, as individual clients need to have separate schedules and reports for their specific campaigns. This limitation presents serious challenges and is incredibly time-consuming, especially if a company currently has multiple clients working with them with individual demands for how they want their reports to help their business.
Another issue that limits the effectiveness of Google Ads’ reporting capabilities is that individuals can only automate some Google Ads reports through the platform rather than every type of Ads report. Many clients anticipate automation for every type of report rather than select reports because they want frequent, on-demand updates on their campaign performance.
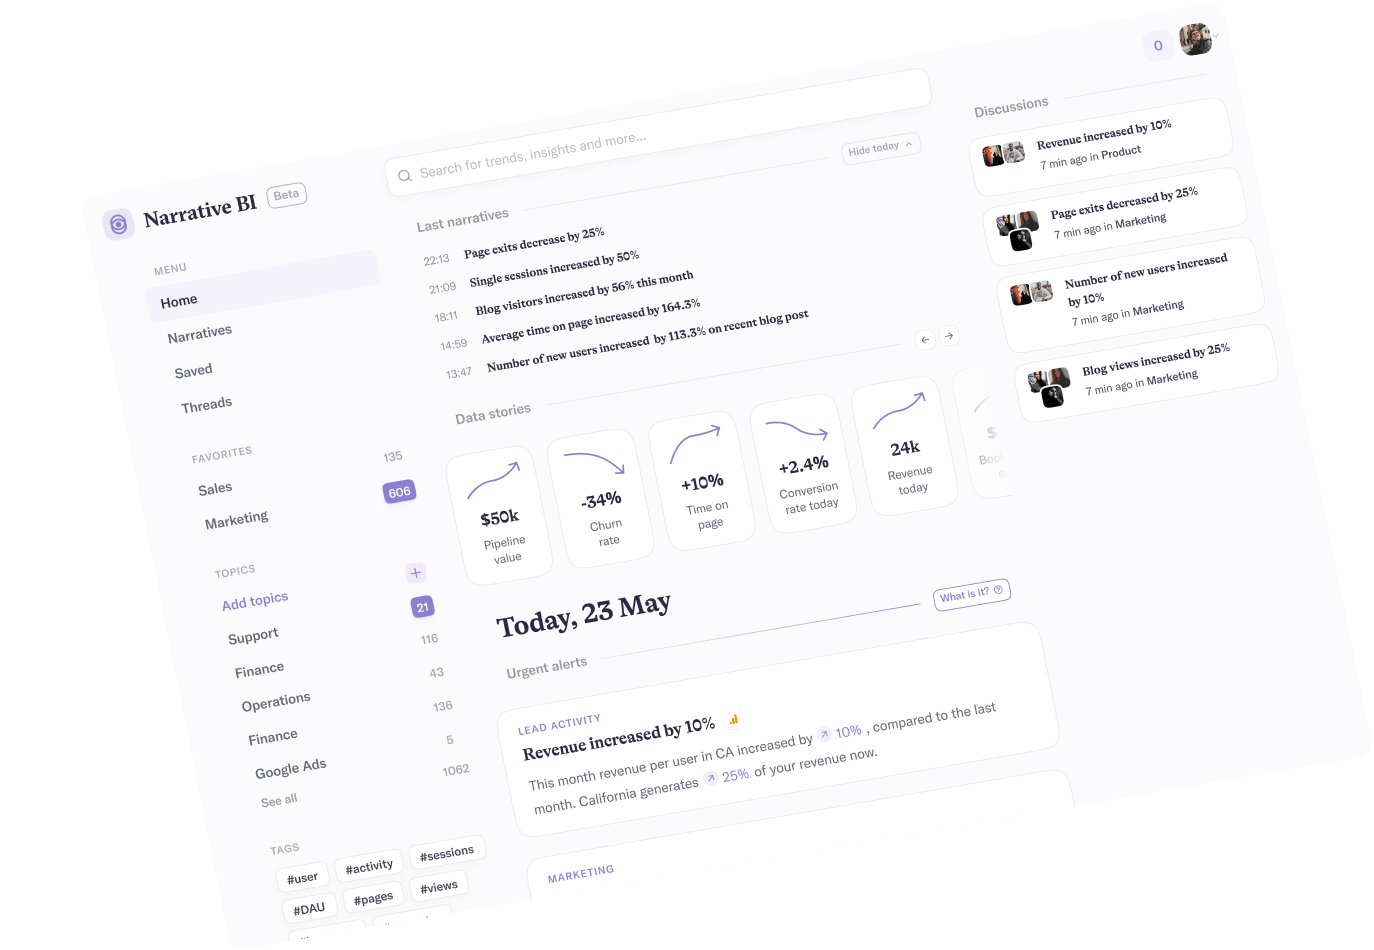
Additionally, there are limitations to what data leaders can automate with Google Ads. This limitation further takes away the value many clients hope for when they turn to Google Ads for their reporting needs. Given this limitation, it’s essential to implement solutions like Narrative BI to automate campaign performance without any limitations and to collect data from several sources in a single platform.
Automating every aspect of Google Ads reporting is the best way to unlock the platform’s possibilities and functionalities. Individuals managing clients that want insights into their ad campaign performance can turn to expert solutions from Narrative BI to automate Adwords reporting and thrive.
Regardless of how often a client wants updates on their Google Ads account, individuals can automatically set up alerts and reports. Hence, clients receive the information they want daily, weekly, or monthly. By automating Google Ads reports with Narrative BI, clients can view data from several sources for a complete overview of all current campaigns.
Narrative BI provides the best way to access analytics on Google Ads. Teams can access automated reports and insights on user conversions and overall ad performance in a simple and automated format. Narrative BI gives teams the tools they need to understand their Google Ads performance on a deeper level. Sign up with Narrative BI to receive marketing reports and insights and meet the client’s needs today.
The Google Ads API makes it easy for developers to create applications that interact with the server for Google Ads, allowing for easier management of ads from one location. The API offers flexibility and control over ad functionality, including the ability to automatically generate keywords, Ad text, landing pages, and custom looks. Plus, users can integrate their Google Ads data and develop tools to simplify campaign management. This is particularly helpful for large or complex campaigns, as all features are available in one convenient location.


 Pro Tip
Did you know that Narrative BI makes tracking your marketing performance effortless? It connects to your digital marketing channels and generates automated reports and alerts.
No more manual work, spreadsheets, and data silos. Narrative BI generates natural language insights in an easy-to-read format so you can focus on growth.
Try Narrative BI for freeConnect your favorite data sources in two clicks and start receiving marketing reports and actionable insights today!
Connect your data sources

Google Analytics is ultra-powerful when it comes to managing our clients’ MarTech stacks, but it’s easy to get lost in the overwhelming amount of data there. Narrative has given us a way to get “just the good stuff”, and the most important metrics we need for making daily decisions on behalf of my agency’s clients from Analytics to Ad Spends. The condensed insights we get from Narrative are incredibly helpful, and now indispensable in our daily mix of tools.


Narrative firstly is a great tool for beginners in marketing analytics - it allows all of our team - even non-technical / analytical get involved! As Mark Ritson said, 'The average is the enemy of the marketer' and Narrative helps us fight that battle every day. Instead of wading through averages, we can spot and evaluate the outliers, the true insights.
