

Facebook ads have become a crucial part of online marketing for businesses of all sizes. However, creating, tracking, and automating reports for Facebook ads can be daunting. That's where automated Facebook Ads reporting comes in handy.
A comprehensive, automated Facebook Ads report can help you understand how your ads are performing, what your audience is engaging with, and what adjustments you need to make to achieve your marketing goals without the hassle of manually collecting and dissecting your crucial ad metrics.
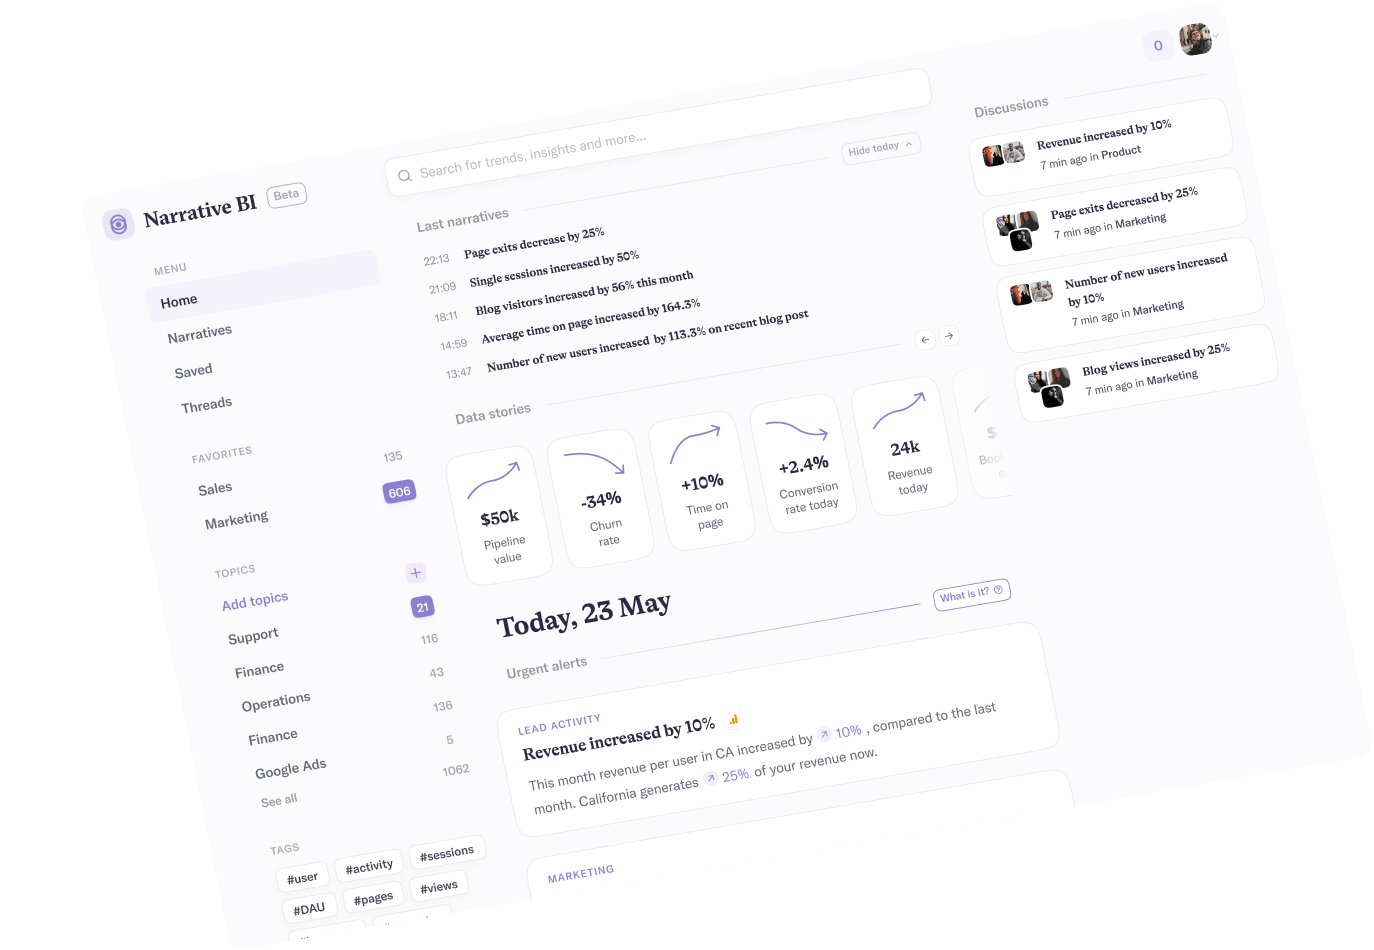
Narrative BI platform is available for accessing automated Facebook Ad reports and eliminating the need for manual data collection. Automated reporting with Narrative BI ensures you can identify your top-performing Facebook ads through detailed insights, allowing you to compare your ad performance over time.

In this article, we'll guide you through creating a Facebook ads report and automating these reports to highlight the essential metrics you need to track to maximize the effectiveness of your Facebook ads.
When you initiate your ad campaign, reviewing the data is most conveniently done through Facebook Ads Manager, where you can assess the performance of each ad you've run.

While the default settings in Ads Manager should provide you with a solid overview of your campaign's progress, you can delve much deeper by making some simple adjustments and utilizing different views.
You can alter your Ads Manager columns to suit your specific ad goals and hide data that isn’t important to your overall objectives. Default Facebook Ads Manager tables include the following columns:

While the default tables include this information, you can edit your columns easily by selecting “Columns” from the dropdown menu in Facebook Ads Manager’s top-right corner:

From here, you’ll see a list of options to select from. This list includes preset options to locate the metrics you need to suit your campaign objectives.

If the preset options don’t work for your objectives, you can customize the columns by selecting “Customize Columns” and “Save as present” if you want to come back to it whenever you need to:

Facebook Ad Manager provides a “Breakdown” menu to explore data subsets and access advanced reporting options. Data subsets fall into the following categories:
All the subsets in your campaign breakdown have numerous options to get clarity and understand your campaign performance. Depending on your advertising goals, you might toggle one breakdown over another or use numerous subsets to understand unique facets of your campaign performance.

Facebook Ads reporting dashboard allows you to toggle breakdowns based on different variables that impact your campaign results, making optimizing your future campaign strategy and reaching new customers easier.

Finally, you must save your campaign reports for future reference and automate the reporting process.
Set up your report by choosing the “Ads Reporting” option from the three-dot dropdown menu. Next, choose the “Create Report” option and choose the chart type you want to create.

Customize your report using the bar on the right-hand side and include the metrics you need included in the final product.

After tailoring the report to your unique needs, select “*Ad account” in the top-left corner of your screen.

In the window that appears, select the “Schedule Email” option. Describe the delivery frequency you want for your reports, and add people to the account to determine who can access the reports.

There are numerous possibilities for metrics to track and analyze through Facebook Ads. Understanding your FB Ads results is only possible when you choose the right metrics to comprehend your ad performance. Let’s explore the most essential metrics to track for successful Facebook Ads results.
A click-through rate (CTR) is the percentage representing the total number of clicks an ad gets divided by the number of advertisement impressions. The CTR can measure a campaign’s effectiveness in encouraging users to continue interacting with an advertisement. Higher CTRs mean your ad is compelling and relevant to your target audience, indicated by high interaction volumes and higher engagement.
Having assets to track your CTR is crucial to understanding your Facebook Ads performance. You can track click-through rates for your site using Narrative BI and set up reports so that you never lose track of your site’s performance. Access narratives via Desktop and create custom alerts.

In contrast, a low CTR indicates your advertisement is not engaging or relevant to users. Click-through rates significantly impact your campaign’s return on investment (ROI) because landing page CTRs are the primary leverage point for an advertiser.
The cost-per-click (CPC) describes a metric used in digital advertising that measures the total cost an advertiser incurs per click on their digital ad campaign. CPC is associated with a pay-per-click advertising model and requires the advertiser to pay a fee whenever a user clicks on their advertisement.
CPC is a crucial metric for your Facebook Ads reports because it lets you understand your spending on driving traffic to your website or landing page. If your CPC is relatively low, you’re acquiring clicks at a low cost, meaning your campaign efforts are more cost-effective than if you had a high CPC.
You can track CPC on your Facebook Ads campaigns and receive reports and valuable insights via email or directly on the Narrative BI platform on a daily, weekly, or monthly schedule.

Sign up for Narrative BI today to understand your ad campaign’s CPC!
A campaign’s cost-per-mille (CPM) describes a metric used to calculate the total cost the advertiser incurs for every one thousand advertisement impressions, meaning that the ad is being displayed to users. CPM is a crucial metric in brand awareness advertising and can help increase brand visibility to reach a wider market.
Advertisers often use CPMs to compare costs between advertising campaigns, ad placements, and platforms to make informed decisions and properly allocate their future advertising budgets.
You can track the CPM on your Facebook Ads campaigns through the Narrative BI platform.

Signing up for Narrative BI allows you to gain valuable insights via reports collected through email or directly on the Narrative BI platform on a daily, weekly, or monthly schedule.
A campaign’s return on advertising spend (ROAS) describes a metric determining the total revenue generated for each dollar spent on a digital ad campaign. This metric allows advertisers to understand better the effectiveness of their current campaign strategy in eliciting customers and driving sales and revenue.
ROAS values greater than one indicate that an ad campaign generates more revenue than the amount spent on advertising, meaning it’s profitable. In contrast, a value lower than one indicates that the campaign is not generating sufficient revenue to cover advertising costs. When your ROAS drops below one, you know something needs to change in your campaign efforts and can start strategizing about future campaign tactics.
Knowing how to create and automate Facebook Ads reports is crucial for any business seeking insights into their advertising efforts. By understanding your Facebook Ads performance and results, you can ensure better results to shift your marketing strategy.

Any advertising manager will benefit by having a holistic view of all key metrics for accessible, seamless reporting. Narrative BI provides you with a complete view of data insights in easy-to-understand reports with automated delivery directly to your inbox.
Narrative BI allows for Facebook Ads analytics integration to track your campaigns and determine strategies to grow your business.
Our actionable insights from Facebook Ads include the following capabilities:
Narrative BI lets you track Facebook Ad metrics easily and all from one convenient location. Plus, our platform is tied into Google Analytics 4 and other marketing tools, providing a single source of truth about the metrics critical to your success. You can effortlessly share insights with your team and clients to optimize your Facebook Ads campaigns.
Connect your Facebook account today by signing up with Narrative BI to find out more about how to transform your Facebook Ads performance!


 Pro Tip
Did you know that Narrative BI makes tracking your marketing performance effortless? It connects to your digital marketing channels and generates automated reports and alerts.
No more manual work, spreadsheets, and data silos. Narrative BI generates natural language insights in an easy-to-read format so you can focus on growth.
Try Narrative BI for freeConnect your favorite data sources in two clicks and start receiving marketing reports and actionable insights today!
Connect your data sources

Google Analytics is ultra-powerful when it comes to managing our clients’ MarTech stacks, but it’s easy to get lost in the overwhelming amount of data there. Narrative has given us a way to get “just the good stuff”, and the most important metrics we need for making daily decisions on behalf of my agency’s clients from Analytics to Ad Spends. The condensed insights we get from Narrative are incredibly helpful, and now indispensable in our daily mix of tools.


Narrative firstly is a great tool for beginners in marketing analytics - it allows all of our team - even non-technical / analytical get involved! As Mark Ritson said, 'The average is the enemy of the marketer' and Narrative helps us fight that battle every day. Instead of wading through averages, we can spot and evaluate the outliers, the true insights.
