

Google Analytics 4 came with an overwhelming amount of new features and functionalities. While this makes it an even more powerful tool than its predecessor, Universal Analytics, it also makes it difficult for users to identify the most valuable features for their unique needs.
One major upgrade to Google Analytics 4 is the presence of new reports and explorations. Some reports are highly technical, while others are not. Therefore, we have curated a list of the top 10 reports that help marketing agencies get started.
{{fs-cta-pro-tip}}
The User Acquisition Report is a great place to start your analysis. It provides a high-level overview of how many users are coming from each channel, how many sessions they're having, and the average session duration. You can use this information to identify your most effective acquisition channels and optimize their performance by adjusting bid strategies or creative optimization tactics (like ad copy).

The User Acquisition Report is a default report in GA4 that focuses on new users and how they found your website or app for the first time. It differs from the Traffic Acquisition Report, which focuses on where new sessions came from, regardless of whether the user is new or returning.
Suppose you want to understand how new users discover your website or app. In that case, GA4's User Acquisition Report is a powerful tool that provides insights into where your new users are coming from and what marketing campaigns drive the most traffic to your site.
To access the User Acquisition Report in GA4, simply login to your Google Analytics account, select Reports from the left menu, and then click on Acquisition > User Acquisition.
The Traffic Acquisition Report is a default report in GA4 that focuses on where users come from and how they interact with your website or app. It differs from the User Acquisition Report, which focuses on new users and how they found your website or app for the first time.

The report includes several metrics that help you understand how users interact with your website or app. These metrics include Sessions, New Users, Bounce Rate, Pages per Session, Average Session Duration, and Goal Conversion Rate.
As a marketing agency, you can use the Traffic Acquisition Report to understand which channels drive the most traffic to their client's website or app. For example, if you are running a social media campaign for a client, you can use the report to see how much traffic is coming from social media and how users interact with the site. You can then adjust your strategy accordingly to improve traffic and engagement.
To access the Traffic Acquisition Report in GA4, select Reports from the left menu. Then, select Acquisition > Traffic acquisition.
The Pages and Screens Report speaks for itself. It shows the pages or screens on your website or app that people visit and engage with. It helps you understand which pages or screens are most popular, how long users spend on each page or screen, and what actions they take after visiting a page or screen. It includes several metrics that help you understand how users interact with your website or app. These metrics include Average Engagement Time, Conversions, Event Count, Total Revenue, Views, Views per User, and Users.

To access the Pages and Screens Report in GA4, follow these steps:
A marketing agency can use the Pages and Screens Report to understand which pages or screens on their client's website or app are most popular and engaging. For example, if a client runs an e-commerce website, you can use the report to see which product pages are most popular, and what actions users take after visiting those pages, and adjust your strategy accordingly to improve engagement and conversions.
The Ecommerce Purchases Report is one of GA’s monetization reports. The GA4 Ecommerce Purchases Report is a new feature in Google Analytics 4 that provides a detailed analysis of your ecommerce transactions. This report allows you to see key metrics such as revenue, conversion rates, and average order value and deeper insights into customer behavior such as product performance, checkout behavior, and purchase history.

You can find the Ecommerce Purchases report by clicking Report on the left tab. Then, select Monetization > Ecommerce purchases.
One of the key takeaways from this report is the ability to track user behavior across multiple devices and sessions. This means you can see how customers interact with your website before and after purchasing, even if they switch between devices or take a break between sessions. This provides a more holistic view of the customer journey and can help you identify areas for improvement in your ecommerce strategy.
Let's say your client runs an ecommerce store that sells athletic apparel; you can use the GA4 Ecommerce Purchases Report to identify products that customers often purchase together. This information can help you create targeted product bundles or recommendations to increase the likelihood of customers buying these items together.
{{fs-cta-testimonial-bloxspring}}
Landing Page Report is a powerful tool that allows you to analyze the performance of your website's landing pages in detail. With this report, you can track metrics such as bounce rate, session duration, and goal completions for each landing page on your site. This information is crucial in identifying which pages are performing well and which need improvement.

Let's say you are running a PPC campaign for a new product launch and want to know which landing pages are performing best. Using the GA4 Landing Pages Report, you can see which pages have the highest conversion rates and adjust your campaign accordingly. For example, if you notice that one landing page has a much higher bounce rate than the others, you can change the page design or messaging to improve engagement.
Another use case could be for an e-commerce site that wants to improve the user experience for mobile users. By looking at the Engagement section of the GA4 Landing Pages Report, you can see how mobile users interact with your landing pages. If you notice that the bounce rate for mobile users is much higher than for desktop users, you can make changes to optimize the mobile experience, such as reducing page load times or simplifying the navigation.
To access the landing page report, From the left menu, select Reports Reports.
On the left, click Engagement > Landing page. You can add it as an administrator or editor if it is unavailable.
The new Funnel Exploration feature in GA4 allows businesses to analyze and visualize user behavior throughout the entire conversion process, from acquisition to conversion. It's different from traditional funnel analysis in Universal Analytics, which only allows businesses to track predefined paths. With GA4 Funnel Exploration, businesses can create custom paths and analyze user behavior based on specific actions or events.

The key takeaway from this page is that Funnel Exploration is a powerful tool for businesses to understand user behavior, identify bottlenecks, and optimize the conversion process. With Funnel Exploration, businesses can easily identify areas for improvement and take action to increase conversions and revenue.
Let's consider an online retailer that wants to increase sales from their website. Using GA4 Funnel Exploration, the retailer can analyze user behavior from acquisition to conversion. They can track custom paths such as "Product Page Viewed," "Add to Cart," and "Checkout Completed." By doing so, they can identify bottlenecks in the conversion process and optimize each step to increase sales.
Another use case could be a software-as-a-service (SaaS) company that wants to increase the number of sign-ups for their service. Using GA4 Funnel Exploration, the company can track custom paths such as "Homepage Viewed," "Pricing Page Viewed," and "Sign-up Form Submitted." By analyzing user behavior, they can identify areas where users drop off and optimize each step to increase sign-ups.
The GA4 Path Exploration Report visually represents user paths, including the sequence and frequency of actions taken on your website. In simpler terms, it allows you to visualize and analyze the paths users take on your website, unveiling critical touchpoints and identifying areas of improvement.

The report helps you identify popular paths, drop-off points, and potential bottlenecks in the user journey by tracking user interactions, such as pageviews, events, and conversions.
Suppose you manage a content-heavy website and aim to increase user engagement and time spent on your articles. With the GA4 Path Exploration Report, you can investigate the most common user paths leading to article exits or low engagement. You can optimize your content strategy by identifying potential reasons for premature exits, such as uninteresting related articles or lengthy paragraphs. For instance, you could enhance the related articles section or introduce more interactive elements to captivate your audience and prolong their stay on your site.
Leverage the report to compare the effectiveness of different page layouts or user journeys. Splitting your audience into different segments allows you to test variations and track their impact on conversions or other desired outcomes. Use these insights to make data-driven decisions and continuously optimize your business.
To start a path analysis, click Explore in the top left corner of the screen and select the Path Exploration template. Analytics provides a sample implementation to get you started. If you want to start with a new path exploration, click Start over in the top right of the screen. Then, select the starting point or ending point for your exploration.
{{fs-cta-integrations}}
Retention is very important for any marketing agency looking to scale. The Retention report in Google Analytics 4 lets you measure user retention and engagement over time, giving you valuable insights into user behavior patterns and loyalty. It displays the percentage of users who return to your site within a selected time frame, providing a comprehensive view of user retention segmented by user type, engagement, and more.

With the GA4 Retention Report, you can segment your audience based on engagement levels, such as frequent readers, occasional visitors, or one-time readers. By analyzing these segments, you can identify the content that resonates the most with your audience, optimize engagement strategies, and develop targeted content to nurture a loyal readership.
Take advantage of the ability to create custom user segments within the GA4 Retention Report. Track metrics like session duration, page views, event completions, or goal conversions to identify high-engagement user segments in the report. You can focus on retaining and nurturing these highly engaged users through tailored campaigns or personalized experiences.
The User Lifetime Report offers valuable insights into each user’s behavior, such as the user’s initial and most recent interactions with your website. It also uses predictive methods to detect purchase and churn probability.

You can identify the marketing channels that bring high-value users with long-term engagement potential. This knowledge helps you to allocate your marketing budget effectively, focusing on channels that yield the best return on investment. You can also evaluate user retention rates across different time frames. Identify the periods where retention drops and implement targeted initiatives such as personalized emails, loyalty programs, or enhanced user experiences to improve user engagement.
If your clients are constantly churning, you can track the initial interactions of the churned customers and how their journeys led to the churn. Any similar pattern in their journeys can be a churn indicator. For example, if all the customers churned after you launched a new feature, it can be a sign that it completely ruined the customer experience and should be cut out.
You can find the User Lifetime Report in the Explorations Template Gallery when you select “Explore” on the left tab.
The Segment Overlap Report showcases the intersection between various user segments, providing insights into the overlapping behaviors of different audience subsets. The report displays a Venn diagram illustrating the overlap between segments, allowing users to visualize the shared audience segments easily. By analyzing the overlap, marketers can identify segments that exhibit similar behaviors or characteristics, enabling them to fine-tune their targeting strategies and tailor their campaigns accordingly.

As a marketing agency, you can utilize the Segment Overlap Report to understand the overlap between users who have subscribed to your newsletter and those who have engaged with your blog. This analysis can reveal the topics and content formats that resonate most with your subscribed audience, enabling you to create more personalized and targeted content, ultimately improving user engagement and retention.
This report is another machine from the Explorations arsenal so that you can find it in the Explorations template gallery.
While the insights from GA4 reports are invaluable for marketing agencies, they also underscore the growing significance of expertise in data interpretation. As the landscape of digital marketing continues to evolve, the demand for skilled professionals in data analytics is on the rise. Whether you're aiming to elevate your agency's analytical capabilities or considering a career pivot, understanding the intricacies of data analytics is crucial. You could learn more about careers in Data Analytics by exploring various online courses, attending workshops, and networking with professionals in the field, positioning yourself at the forefront of this dynamic and essential domain.
Google Analytics 4 is the source of marketing information and conversion tracking. The more understanding you have about reports, the better decisions you can make in your marketing activity and improve your ROI. However, manually analyzing this data can be time-consuming and overwhelming. That's where Narrative BI comes in. By automating the reporting process for your agency and providing actionable insights, we can help streamline reporting and save time, allowing agencies to focus on what they do best - creating effective marketing campaigns. Sign up today and start seeing results! That's where Narrative BI comes in.


 Pro Tip
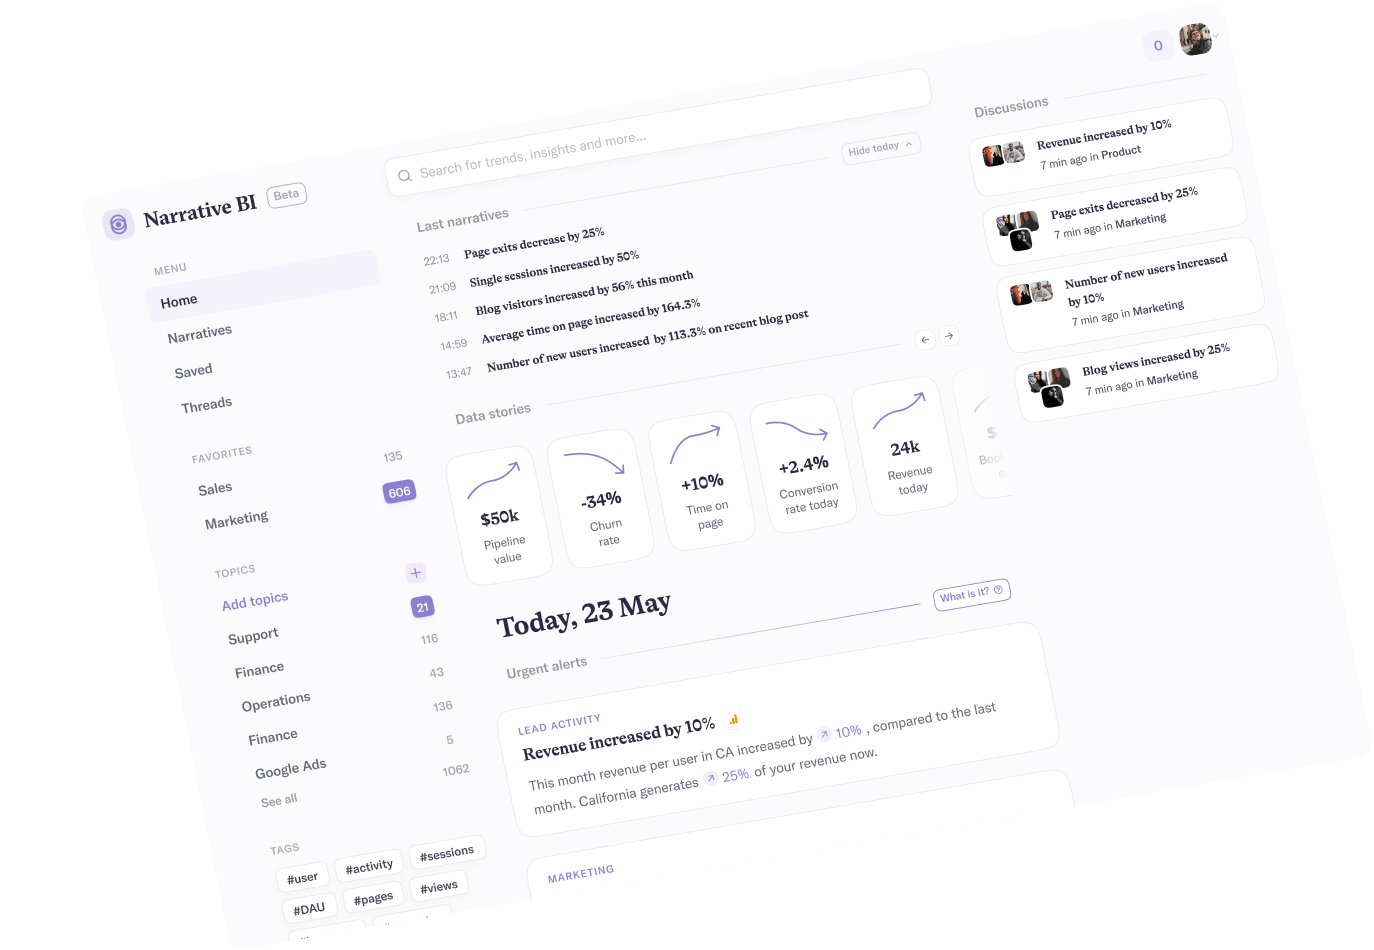
Did you know that Narrative BI makes tracking your marketing performance effortless? It connects to your digital marketing channels and generates automated reports and alerts.
No more manual work, spreadsheets, and data silos. Narrative BI generates natural language insights in an easy-to-read format so you can focus on growth.
Try Narrative BI for freeConnect your favorite data sources in two clicks and start receiving marketing reports and actionable insights today!
Connect your data sources

Google Analytics is ultra-powerful when it comes to managing our clients’ MarTech stacks, but it’s easy to get lost in the overwhelming amount of data there. Narrative has given us a way to get “just the good stuff”, and the most important metrics we need for making daily decisions on behalf of my agency’s clients from Analytics to Ad Spends. The condensed insights we get from Narrative are incredibly helpful, and now indispensable in our daily mix of tools.


Narrative firstly is a great tool for beginners in marketing analytics - it allows all of our team - even non-technical / analytical get involved! As Mark Ritson said, 'The average is the enemy of the marketer' and Narrative helps us fight that battle every day. Instead of wading through averages, we can spot and evaluate the outliers, the true insights.


