For over a decade, Google has revolutionized how marketers visualize and analyze website data with their Universal Analytics (UA) platform. In October 2020, Google introduced Google Analytics 4 (GA4), what they call "the next generation of analytics." By July 2023, Universal Analytics is going to be completely phased out. This means that everyone using UA should have transitioned to GA4 by then.
So if you want to transition to Google Analytics 4, the best time to do that is yesterday to help you get acquainted and build up historical data on the platform. In this article, you will learn everything you need to know about how Google Analytics 4 works, what it offers, and how it differs from the previous versions. You'll also learn how to migrate from Universal Analytics to Google Analytics.
{{fs-cta-pro-tip}}
Google Analytics 4 (GA4) is the 4th and newest version of Google's analytics software. It provides a more privacy-focused approach for tracking and analyzing user behavior across different data streams.
The data measurement model is the main difference between GA4 and the former versions. Universal Analytics uses a "sessions + page view" measurement model.
GA4, on the other hand, uses an "Event + Parameter" measurement model. It processes each user interaction as an event. This model enhances behavior prediction and enables you to track user-centric activities, including page views, traffic, and engagement across your websites and apps.
GA4 has bridged the gap between measuring website and app data. Before GA4, marketers and analysts tracked website and app data using two tools – Google Analytics Property and Google Analytics for Firebase. However, the GA4 property, formerly known as "App + Web" has bridged this gap. Now, you can combine App and Web usage data for unified analysis and reports using data streams.
Google Analytics 4 was initially introduced to improve privacy standards and comply with the General Data Protection Regulation (GDPR) rules.
Universal Analytics tracked users and collected data using third-party cookies. However, UA started having significant data gaps with the rise of cookie blocking, new privacy regulations, and increasing ad blocker usage.
The new GA4 uses a machine learning model instead of cookies to provide access to user behavior and traffic data while protecting user privacy.
You can set up more than one GA4 property with a Google Analytics account. Each GA4 property currently provides one reporting view, which contains data from one or more data streams. A data stream is a data source, and it can be either a web or an app. The app data stream is further divided into IOS and Android app data streams.
There are two versions of GA4, the GA4 standard and GA4 360. GA4 standard is free, while GA4 360 is a paid version that provides higher limits for data collection, retention, reporting, and BigQuery exports.
Google Analytics 4 is equipped with many feature changes explicitly designed to help marketers and analysts measure user interactions in a privacy-first way.
The event tracking feature is the major standout feature in Google Analytics 4 and the core of the platform's data measurement model. Every interaction on your website or app is recorded as an event, including page hits, social interaction hits, and even user sessions. For example, users can trigger a scroll event when they reach the bottom or at least 90% of a web page.
In GA4, events are divided into four categories:

They let you measure how users interact with your content. For example, the form_start event is triggered when a user interacts with a form for the first time.
Events also existed in Universal Analytics, but it was created by setting up tags and triggers in Google tag manager and then sent to your Universal Analytics property. GA4 uses events to track all data types. This feature provides more insight for marketers. For example, if a form_start event is triggered by different users without the form_submit event, it can indicate that the form needs to be optimized so users can make it to the end.
Artificial intelligence prediction is one of the new features available in GA4. This use of AI helps you highlight data trends and generate prediction-based outcomes such as an increase in demand, churn rate, potential revenue, conversion probability, and purchase interest. You can make data-driven decisions and predict your audience's future behavior with insights like these.
There are many other benefits of AI prediction in GA4. It fills in the data gaps that come with users rejecting cookies due to the cookie consent policy. These gaps are filled by segmenting users with similar traits and behaviors into cohorts. Each cohort's behavior is then tracked for future prediction.
Other benefits include detecting anomalies, observing trends, and generating automated insights, saving you a lot of time.

It also allows you to customize the metrics you want to monitor and alerts you to important data patterns and changes. It also helps you know where to invest your business time and resources and what to focus on to improve your marketing strategy.
The DebugView feature is designed for checking incoming data from all user properties, events, and event parameters in your GA4 property. It can also help you understand user behavior and troubleshoot issues as they arise.
You can use the DebugView report by enabling debug mode and going to Configure > DebugView on the left column of the GA4 interface. The DebugView UI is split into five sections:

It is possible to enable "debug mode" in multiple devices because GA4 has a Device Selector option that lets you choose which device's DebugView report you want.
User lifetime report in GA4 allows you to analyze user behavior and value throughout their lifetime as customers on your website or app. It can help you find specific user behavior insights, such as users with lower churn probability or the channels that drove users with the highest lifetime revenue. You can analyze the campaign with higher user acquisition and even the last purchase from your website or app in terms of lifetime value.

The user lifetime report displays all your users aggregated data, including their initial interactions, most recent interactions, lifetime interactions, and predictive metrics, which can predict purchase probability, churn probability, and many other user-centric behaviors.
Cross-platform tracking allows you to identify and attribute activities to a single user as they move across different domains. It lets you see the entire user journey, including acquisition, engagement, monetization, and retention. For example, you can set it up if you want to know when a user moves directly from your website to a product review website like G2.
GA4 has four identity methods for creating a unified view of the cross-platform user journey. They include UserID, Google signals, Modeling, and Device ID. To set up cross-platform tracking in your GA4 property, follow these steps:
GA4 has deeper Google Ads Integration features compared to Universal Analytics. Its personalized advertising feature is enabled by default, which means that your GA4 audience lists and remarketing data will automatically be available in Google Ads. You can also allow the auto-tagging feature to pull data from Google Ads into your Analytics reports.
To link Google Ads to your GA4 property, you need editor permission in Google Analytics and administrator permission in Google Ads. After connecting, you'll automatically see your Google Ads data in your GA4 reports. You can link your GA4 properties to different Google Ads accounts, but you can only create up to 400 Google ad links per GA4 property.
However, you can import your Google ads links from Universal Analytics into GA4 using the Google Ads links migration tool. When you link Google Ads to GA4, you'll see how users interact with your ads and how they finally convert into customers. You'll also be able to improve your Google ads remarketing with GA4's audience data.
{{fs-cta-testimonial}}
Explorations give you access to analytical reports and data that aren't available in standard GA4 reports. It also has a collection of advanced techniques that help you gain deeper insights into user journeys and customer behavior.
There are three sections in exploration: the canvas, variables, and tab settings. The Canvas displays your data using the selected technique, while variables give you access to dimensions, metrics, and segments for your exploration. Tab settings help you configure technique-specific options.
The exploration techniques supported in Ga4 include free form, cohort exploration, funnel exploration, segment overlap, path exploration, user exploration, and user lifetime.

GA4 has a different reporting interface compared to Universal Analytics. GA4's reporting is more structured and easier to navigate. It also gives you access to a custom report visualization builder, which allows you to create reports based on specific needs.
GA4 reports are available within the left navigation, and they display data you can use to uncover trends more quicker. There are four broad categories in GA4's reporting interface: Lifecycle reports, User reports, App developer reports, and Games reporting.

A conversion is an interaction that moves a user further down the purchase funnel. It could be a form submission, a file download, a demo schedule, etc. In Google Analytics 4, you can log every event that contributes to your business's success as conversions, and each time they are triggered, GA4 will register a conversion in your GA4 property.
Google Analytics 4 already has many predefined conversions that can't be disabled, such as in-app purchases, app store subscription convert, and first open.
If you want to flag an event as a conversion, go to your GA4 property, and click on Configure > All Events. Scroll to the event you wish to flag as a conversion and switch the toggle to "On".
Big Query is a cloud-based data warehouse that lets you manage and analyze queries on large datasets. You can export all events from your GA4 properties to BigQuery and then use SQL-like syntax to query the data. Big Query Export was previously available to only GA4 360 users, but all GA4 property owners can now use BigQuery to store and analyze event data collected from their apps and websites.
You can join your event data with other marketing data and visualize them using tools like Tableau, PowerBI, or Data Studio. To set up the BigQuery export feature, you only need a GA4 property and a Google cloud project with admin rights.

There are many differences between Google Analytics 4 and Universal Analytics, some of which include the following:
{{fs-cta-integrations}}
These are the different types of reports you can analyze as a GA4 user:
The Acquisition report gives you insights into user behavior on your website and helps you identify the channels that bring the most traffic and revenue. It also enables you to measure your marketing campaign's performance. Knowing this, you'll be able to optimize your marketing strategy and allocate your resources effectively.
The acquisition reports available in GA4 include acquisition overview, traffic acquisition, user acquisition, and Google Ads campaign reports. To access reports in GA4, click Reports > Acquisition in the left navigation.
The Engagement report helps you measure the events and conversion events that trigger user engagement. It also enables you to identify the web pages and app screens with the highest user engagement. The engagement reports available in GA4 include engagement overview, user stickiness, and user engagement report.
To access your engagement reports in GA4, click Reports > Engagement in the left navigation.
The monetization report shows you the revenue generated from your website's products, ads, and subscriptions. It helps you identify your revenue sources. The monetization reports available in GA4 include monetization overview, in-app purchases, e-commerce purchases, and publisher ads reports.
To access monetization reports in GA4, go to reports> monetization in the left navigation.
The retention report shows how long and frequently users engage with your web pages after their first visit. You can access six retention reports in GA4, including the Lifetime value chart, user engagement report, user engagement by cohort, user retention, and user retention by cohort.
Click Reports > Retention in the left navigation to access retention reports in GA4.
The exploration report gives you access to in-depth data analysis and data visualization that helps you uncover insights about user behavior and journey on your website or app. You can create up to 200 individual and 500 shared explorations per GA4 property.
To access exploration reports in GA4, click explore, you'll see a list of templates and an option to create a custom report.
The advertising snapshots report helps you explore key business metrics like conversion performance and customer acquisition costs. There are three summary cards for advertising snapshots in GA4, and each card helps you answer a relevant business question.
The summary cards include conversion paths, conversions by default channel group, and model comparison snapshots. In addition, there's also an insights card that shows you emerging patterns in your advertising data.
Google doesn't offer automated migration because the Universal Analytics data model differs from GA4. If you already have a Universal Analytics account, you will notice a "GA4 Setup Assistant" option in your Admin section that will guide the migration process to GA4.

While Google has provided tools to help you associate some Universal Analytics properties with your new GA4 property, you will still need to configure your account from scratch. However, configuring a GA4 property is relatively simple, and fortunately, Google offers an onboarding process for a smooth transition.
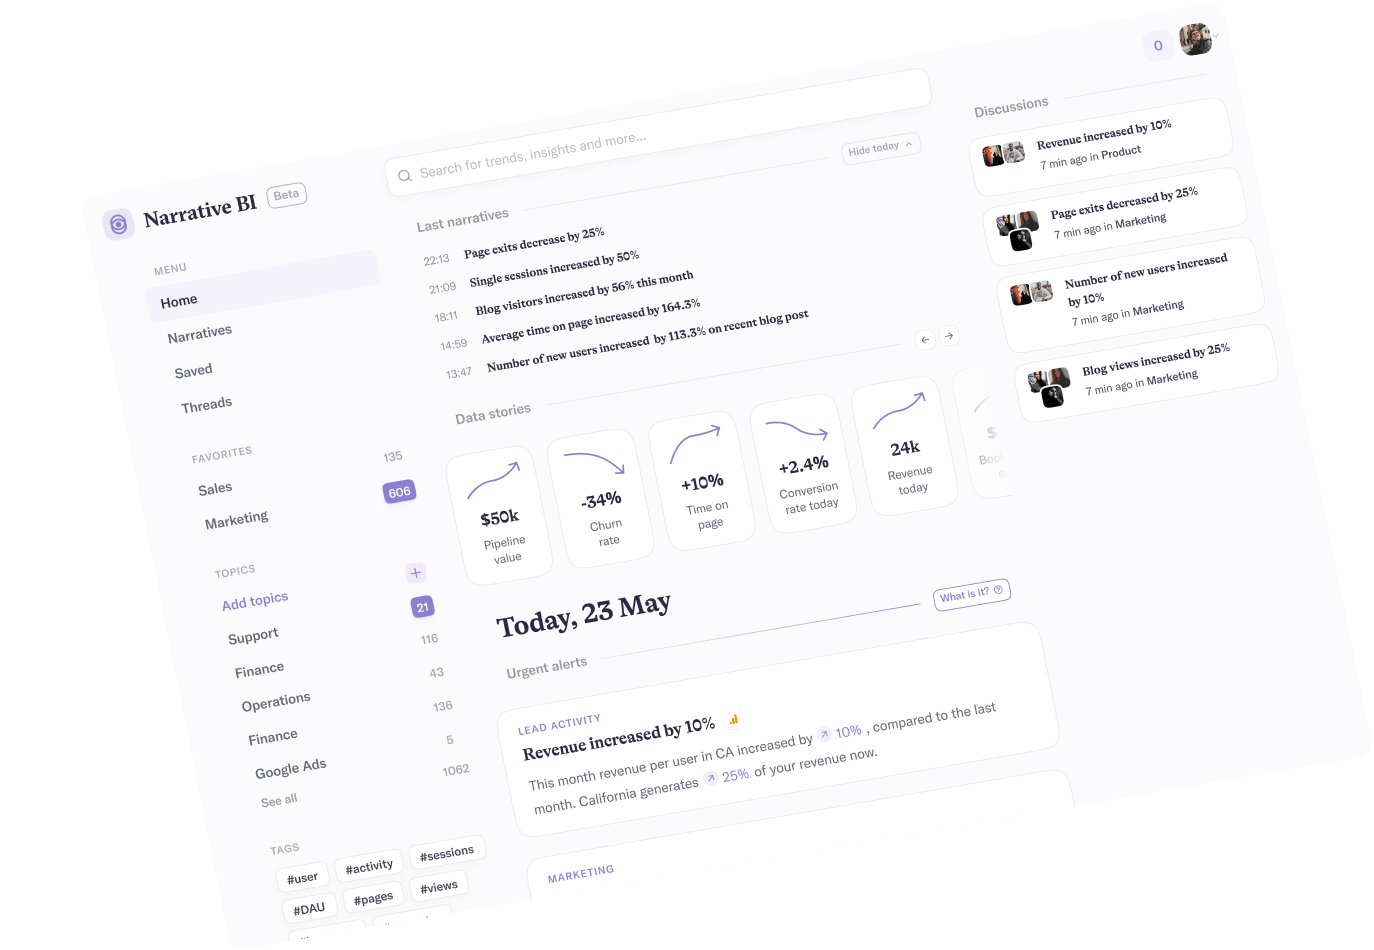
Google Analytics 4's event-based measurement model provides insight into how customers interact with your marketing funnel. You can now get a complete and accurate overview of your customer's journey across all channels and devices. Narrative BI provides you with conversion insights in your reports to help you identify what works best.


 Pro Tip
Did you know that Narrative BI makes tracking your marketing performance effortless? It connects to your digital marketing channels and generates automated reports and alerts.
No more manual work, spreadsheets, and data silos. Narrative BI generates natural language insights in an easy-to-read format so you can focus on growth.
Try Narrative BI for freeConnect your favorite data sources in two clicks and start receiving marketing reports and actionable insights today!
Connect your data sources

Google Analytics is ultra-powerful when it comes to managing our clients’ MarTech stacks, but it’s easy to get lost in the overwhelming amount of data there. Narrative has given us a way to get “just the good stuff”, and the most important metrics we need for making daily decisions on behalf of my agency’s clients from Analytics to Ad Spends. The condensed insights we get from Narrative are incredibly helpful, and now indispensable in our daily mix of tools.


Narrative firstly is a great tool for beginners in marketing analytics - it allows all of our team - even non-technical / analytical get involved! As Mark Ritson said, 'The average is the enemy of the marketer' and Narrative helps us fight that battle every day. Instead of wading through averages, we can spot and evaluate the outliers, the true insights.